From Numbers to Drill Targets: QA/QC and Reading Real Anomalies
The dataset that was perfect and still wrong
It’s possible to run a geochemical survey with flawless precision, clean blanks, spot-on standards, and tight duplicates — and still drill a hole that finds nothing. Statistics can confirm that a
dataset is trustworthy. They cannot tell you what the numbers actually mean geologically. That gap between “the data is good” and “the data means what we think it means” is where
exploration programs succeed or fail, and it’s the thread tying together everything in this series.
This is the standard we hold every dataset to across our Tanzania programs — from soil surveys on the Jomu, Kahama, and Geita gold clusters to graphite work in Tanga and Lindi, where
diamond and RAB drilling have already progressed toward resource estimation.
Why sample mass matters more than it seems
Every soil sample is a small representation of a much larger population, and that representation can fail in either direction. Too little sample material produces high variability and poor
representativeness; too much adds cost and handling burden without proportional benefit.
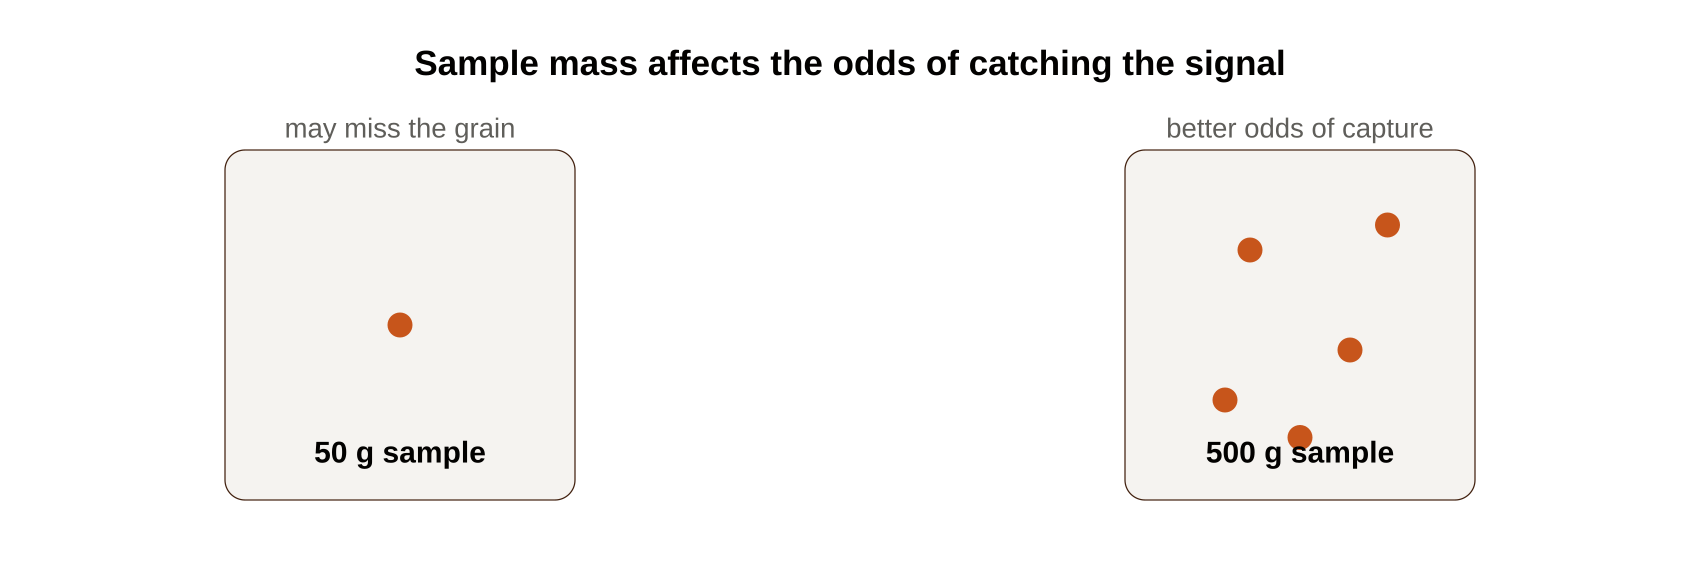
Gold makes the point vividly. If a single gold grain sits within the sampled volume, a 50 g sample may simply miss it, while a 500 g sample has a meaningfully better chance of capturing it.
Sample mass directly affects precision, representativeness, and reproducibility — it’s a design decision, not an afterthought.
Contamination: what it looks like and where it comes from
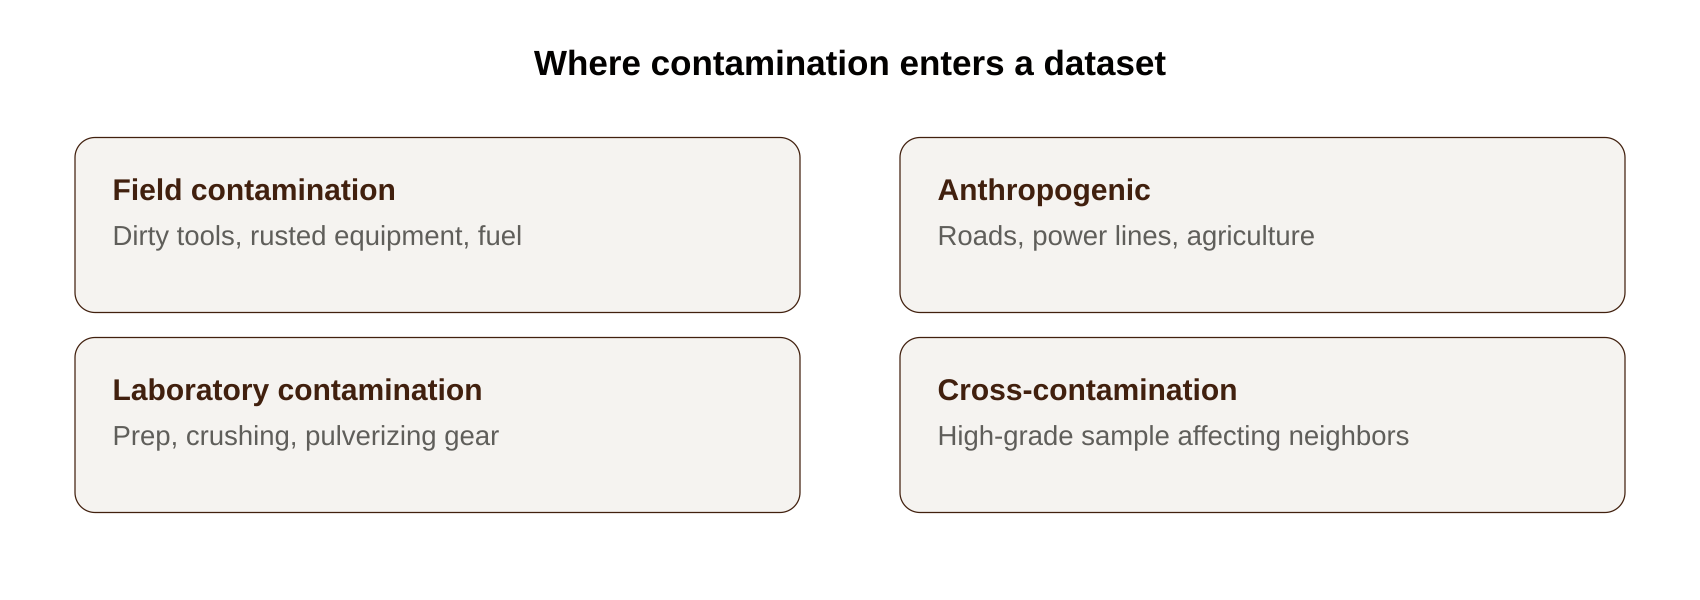
Contamination can enter a dataset at several distinct points, each with its own signature:
Recognizing these patterns is part of routine dataset review, not a one-time check at the end of a program.
Precision is not the same thing as geology
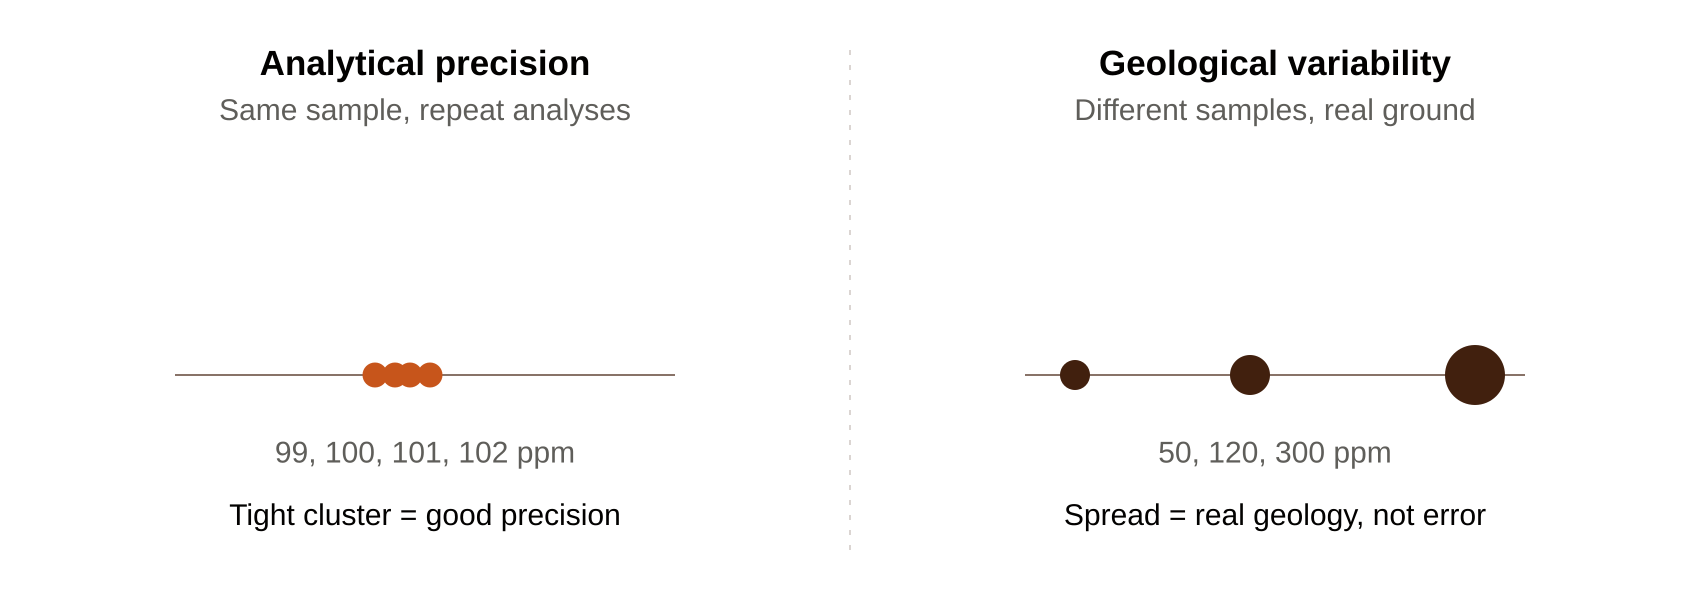
This distinction trips up more people than it should. Analytical precision measures laboratory repeatability — running the same sample through the lab four times and getting 99, 101, 100, and
102 ppm is excellent precision. Geological variability represents genuine natural variation in the ground — samples reading 50, 120, and 300 ppm across a small area may be entirely
geological, reflecting real changes in the rock, not lab error.
A laboratory can be extremely precise while the underlying geology remains highly variable, and conflating the two leads to misreading real geological signal as noise, or noise as signal.
Related to this: two subsamples from the same pit rarely produce identical results, because soil is heterogeneous — different proportions of clay, quartz, sulfides, and organic matter between
subsamples is normal. The purpose of duplicate sampling isn’t to chase perfect agreement; it’s to quantify how much variability exists and confirm it sits within acceptable limits.
Blanks, standards, and duplicates: the foundation of QA/QC
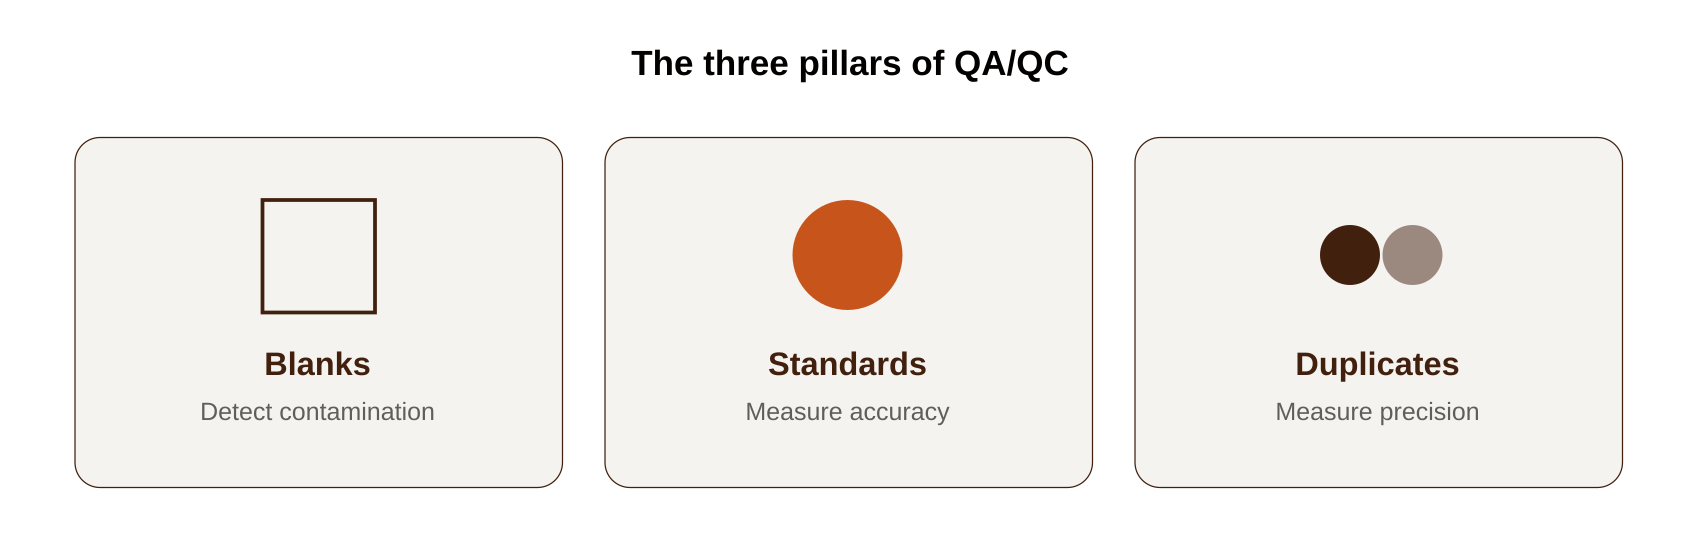
Together, these three tools form the backbone of a defensible dataset:
Without this framework in place, no reliable interpretation of the underlying geochemistry is really possible — the numbers might be real, or they might not be, and there’s no way to tell the
difference after the fact.
QA/QC discipline like this runs through every soil program we execute — it’s a non-negotiable part of how we build a dataset investors can actually rely on across our active licenses.
Download the Investor Deck →
Spotting systematic bias before it costs you
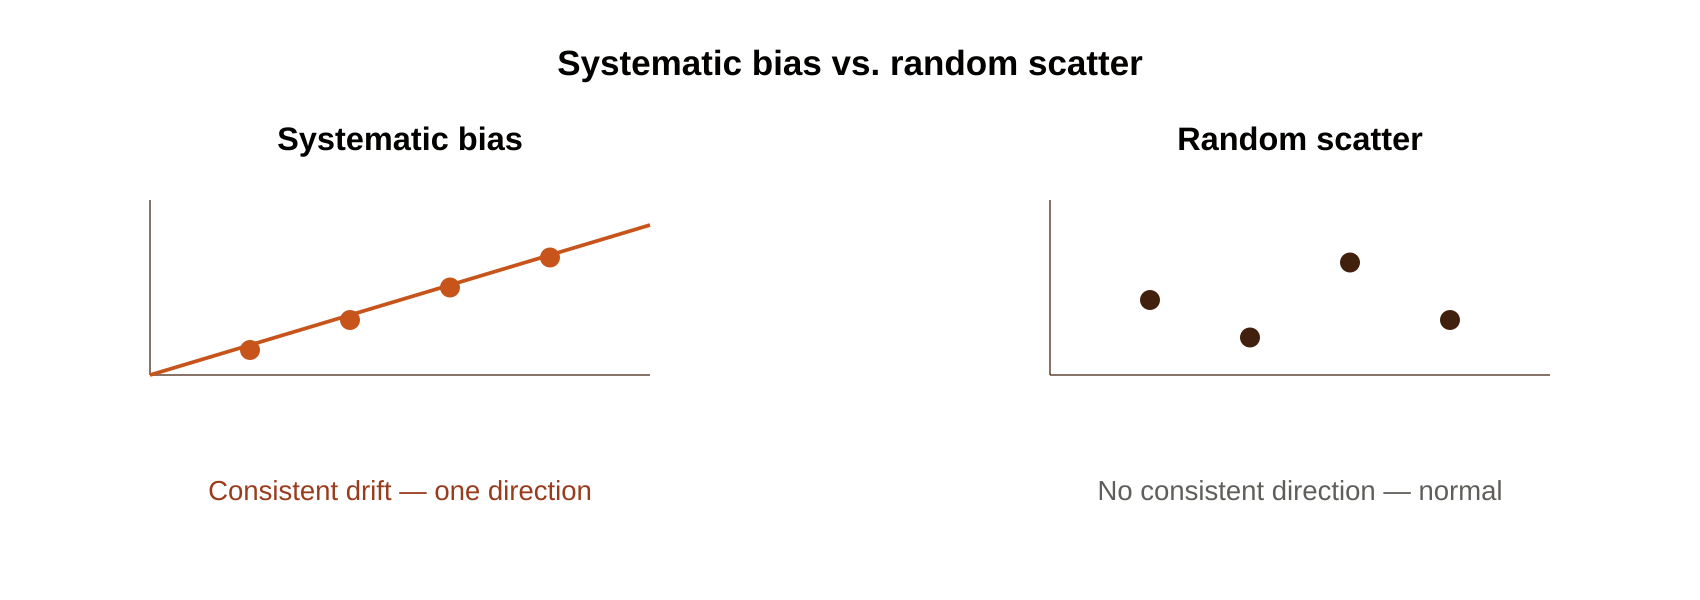
Systematic bias shows up as a consistent pattern of error rather than random scatter. Common indicators include field patterns (every sample from one crew reading higher — often traced to
contaminated tools), spatial patterns (anomalies that suspiciously coincide with roads), QA/QC failures (a certified 100 ppm standard consistently reporting 120 ppm, indicating analytical
bias), and duplicate trends that consistently disagree in one direction rather than scattering randomly.
The habit that catches most of this early is simple to state and hard to maintain discipline around: “Is this anomaly geological, or is it an artifact of the sampling process?” Asking that question of every result, not just the surprising ones, is what separates programs that catch their own mistakes from ones that drill them.
Reading the pattern, not the peak
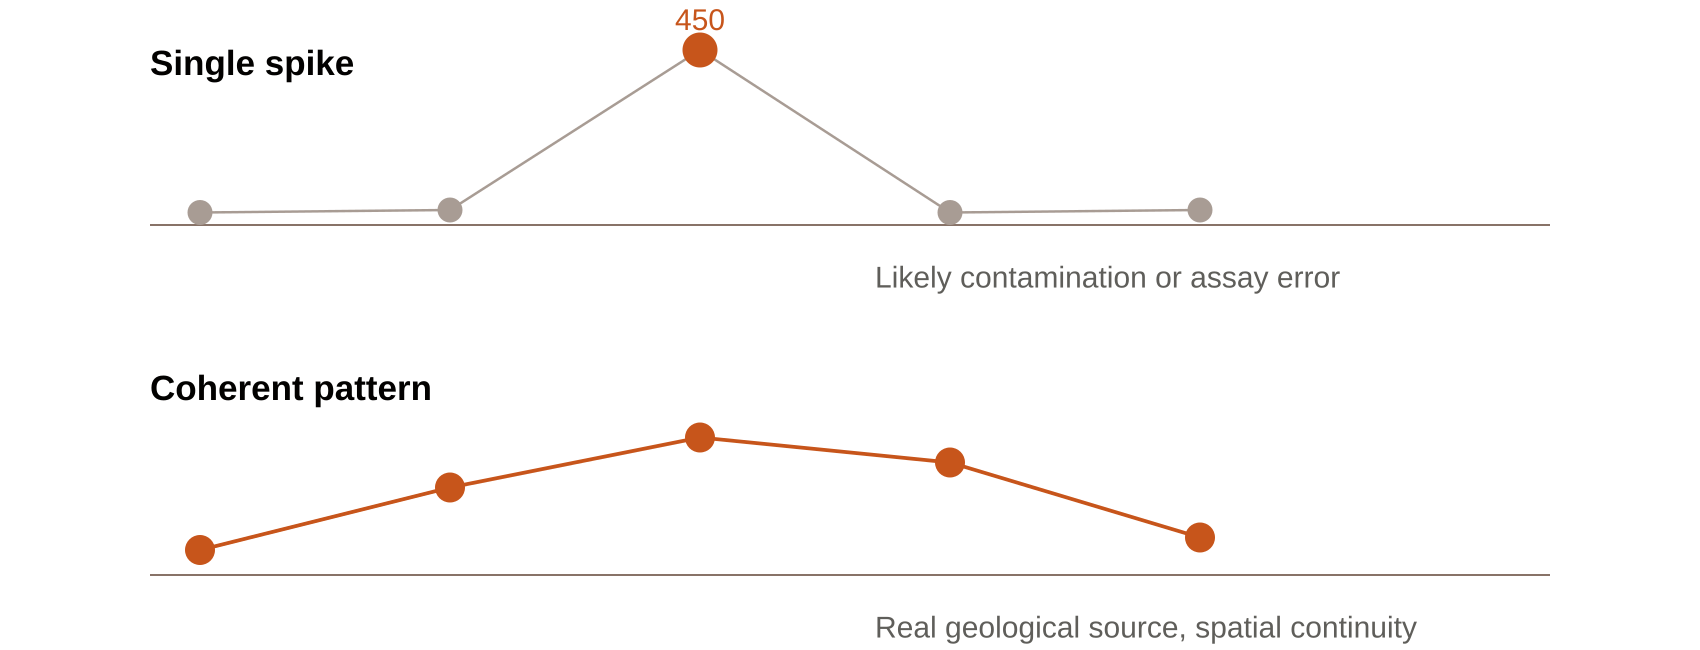
A single spectacular value — say 450 ppm sitting among a run of readings in the 10–13 ppm range — is more likely to represent contamination, assay error, or a stray float fragment than a
genuine target. A coherent run of moderately elevated values (80, 120, 150, 130, 90) is generally more trustworthy, because mineral systems are geological bodies, not isolated points, and real
systems tend to produce spatial patterns rather than lone spikes.
A genuine anomaly typically shows spatial continuity, geological support (association with faults, contacts, or alteration zones), multi-element association, and reproducibility on infill
sampling. High assay values alone are insufficient grounds to trust an anomaly — experienced geologists routinely reject spectacular-looking single points when the supporting pattern isn’t
there.
This same logic explains why amplitude (strength) and size (spatial extent) matter differently. A high-amplitude, small anomaly may reflect a tiny high-grade vein that isn’t necessarily
economic. A lower-amplitude but large anomaly may reflect a broad system like a porphyry deposit — potentially far more significant despite the less dramatic peak value. The best targets
typically show good amplitude, good continuity, and geological support together, not any single one of those in isolation.
Special case: lateritic terrain
Lateritic terrains — common across India, Australia, Brazil, and West Africa — add their own layer of interpretive difficulty. Intense weathering can alter the original rock signature, strong
secondary enrichment can concentrate elements independently of actual ore grade, and metals may redistribute both vertically and laterally through thick weathering profiles. Horizon
identification itself becomes harder, since B, BC, ferruginous, and lateritic horizons can overlap and blur together. Lateritic geochemistry demands careful orientation studies and specialized
interpretation rather than standard assumptions carried over from temperate terrain.
This is the kind of terrain-specific expertise
Sakariya Geo Services brings to due diligence and mineral exploration engagements — recognizing when standard interpretation frameworks need to be adapted to the ground in front of you.
Integrating beyond geochemistry alone
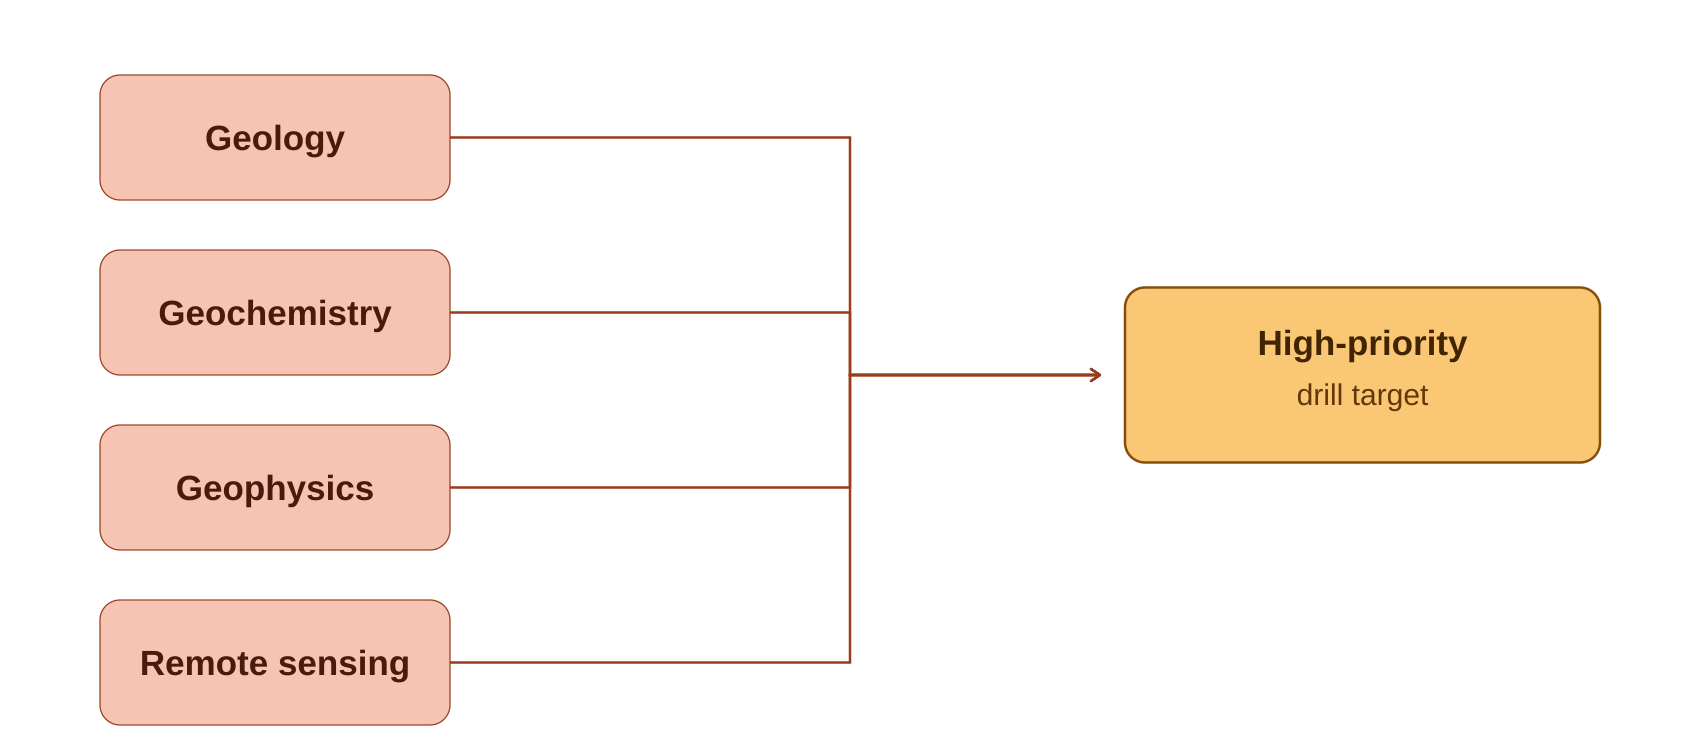
No single dataset should be interpreted in isolation. Geology contributes lithology, structure, and alteration context. Geochemistry contributes dispersion patterns and pathfinder signatures.
Geophysics contributes depth information, geometry, and detection of concealed targets. Remote sensing contributes alteration mapping, structural trends, and surface mineralogy.
A high-priority drill target typically emerges where multiple independent lines of evidence stack up — an arsenic anomaly, coincident with an IP chargeability high, sitting on a shear zone with
visible alteration, for example. Multiple datasets pointing the same direction reduce uncertainty in a way that no single dataset can achieve alone.
The one lesson underneath all fifty questions
If there’s a single idea worth carrying out of this entire series, it’s this: a soil sample is not a measurement of ore. It’s the final expression of a long chain of processes — mineralization,
weathering, element release, transport, adsorption, accumulation, sampling, analysis, interpretation. Every link in that chain can strengthen, weaken, distort, or completely erase the signal from
the deposit below.